3 minutes
Monitoring to detect incidents
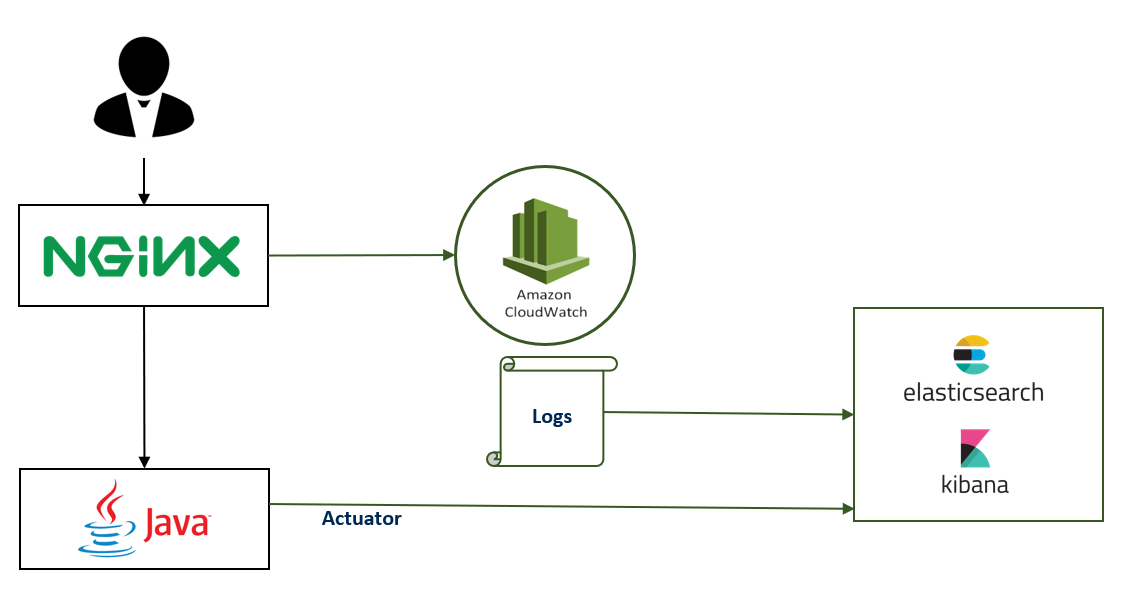
Recently, I have worked with a team developing a Spring Boot application. The application is deployed as a Java container in AWS and the logs are stored in Cloudwatch.
The application was put behind an Nginx reverse proxy and Nginx logs are also stored in Cloudwatch.
Every thing was going fine until they started adding new features that caused very high response times on the prod. Problems become more and more recurrent, developers were exhausted dealing with all this headache and users were very unsatisfied.
I tried to help this team and the first step was to see what is going on. I found out that even developers struggle to get the real cause of problems and they often have to pass hours reading thousands of line of logs in Cloudwatch and the fixes they made were usually temporary.
For me, there was missing a crucial element for the functioning of any development team : monitoring. We had a lot of data in our possession but nothing was done to get useful information from that.
Thus, I decided to implement a monitoring solution using Elasticsearch and Kibana. First, I worked on sending all the information from Cloudwatch logs to Elasticsearch. I used Filebeat with the following input module : AWS Cloudwatch Input (https://www.elastic.co/guide/en/beats/filebeat/current/filebeat-input-aws-cloudwatch.html). This module calls AWS API regularly to get new lines of logs.
In addition, I found out that an Actuator endpoint was available and developers use it to expose application metrics using Prometheus format. I used Metricbeat to scrap those metrics and send them to Elasticsearch (https://www.elastic.co/guide/en/beats/metricbeat/current/metricbeat-module-prometheus.html).
After ingesting and filtering data using Logstash and storing them in Elasticsearch, came the rewarding part of creating visualitions and dashboard in Kibana.
I have made out 2 different types of Dashboards:
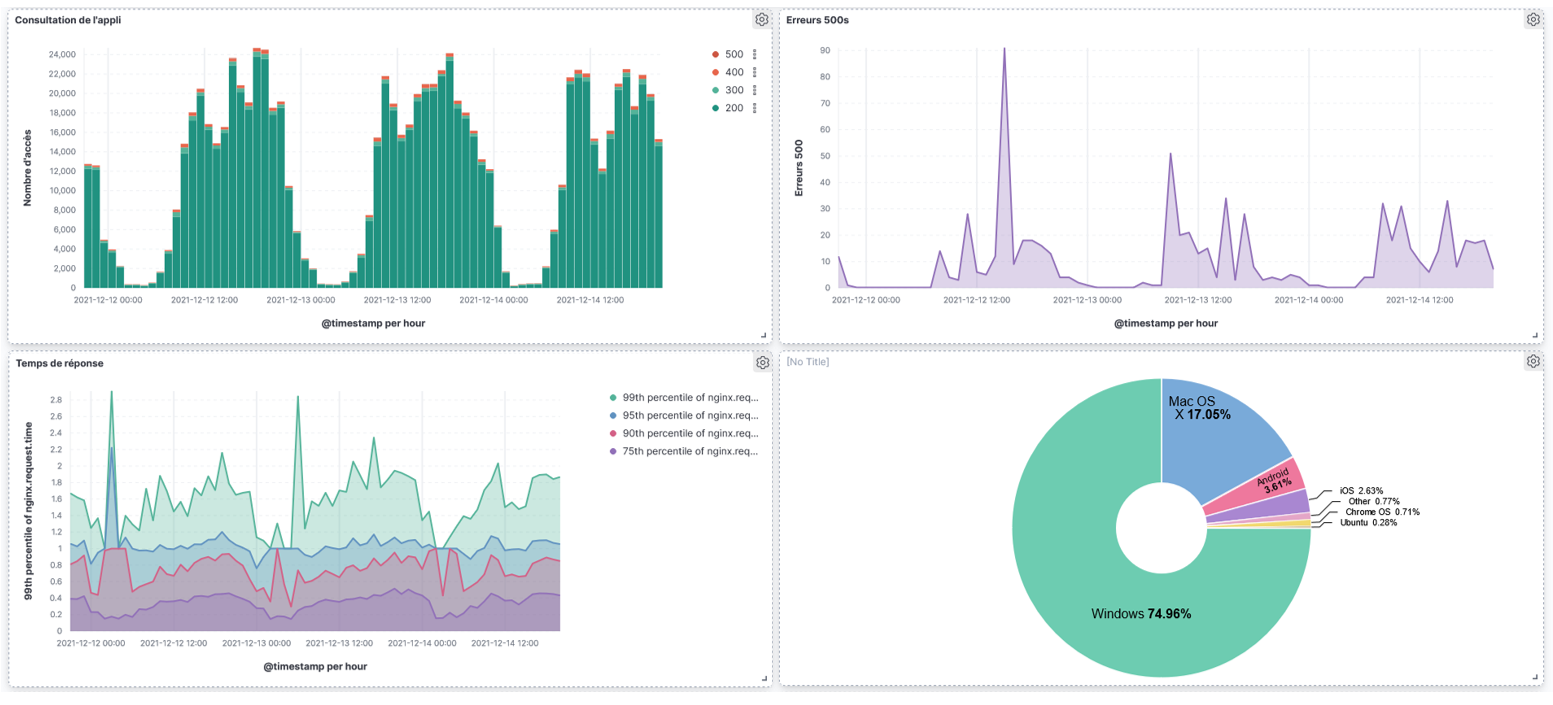
Nginx dashboard: user experience metrics
This dashboard contains metrics about the user experience : number of requests, 500 errors, response time, visitors per day, OS, most visited URLs…
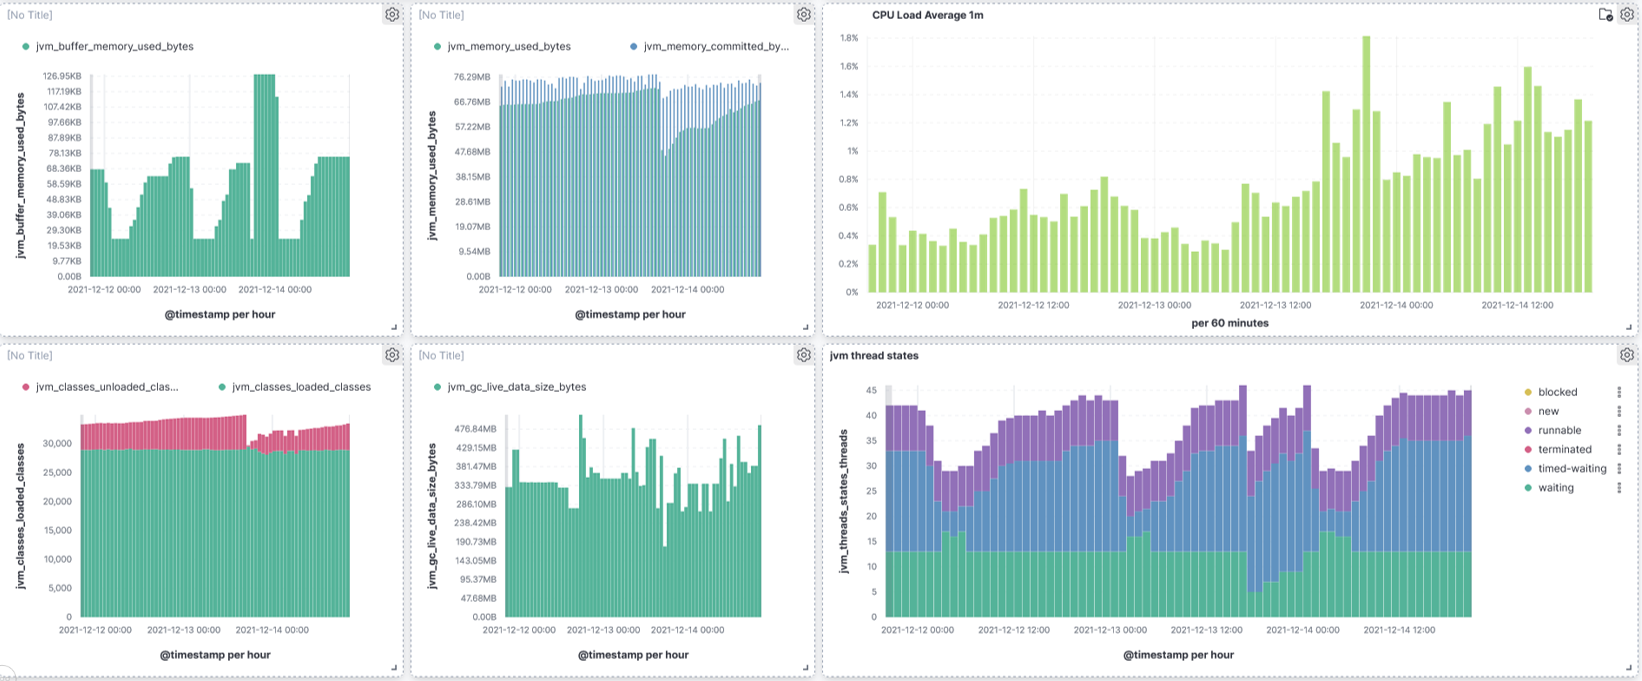
Prometheus dashboard: application metrics
This dashboard contains metrics about the java application : methods execution time, http requests, JVM metric, 500 errors by URL and by Stacktrace…
Realcase situation of detecting an incident
Using this monitoring tool, I went back to a recent incident in Production and I tried to detect it just using the metrics I have.
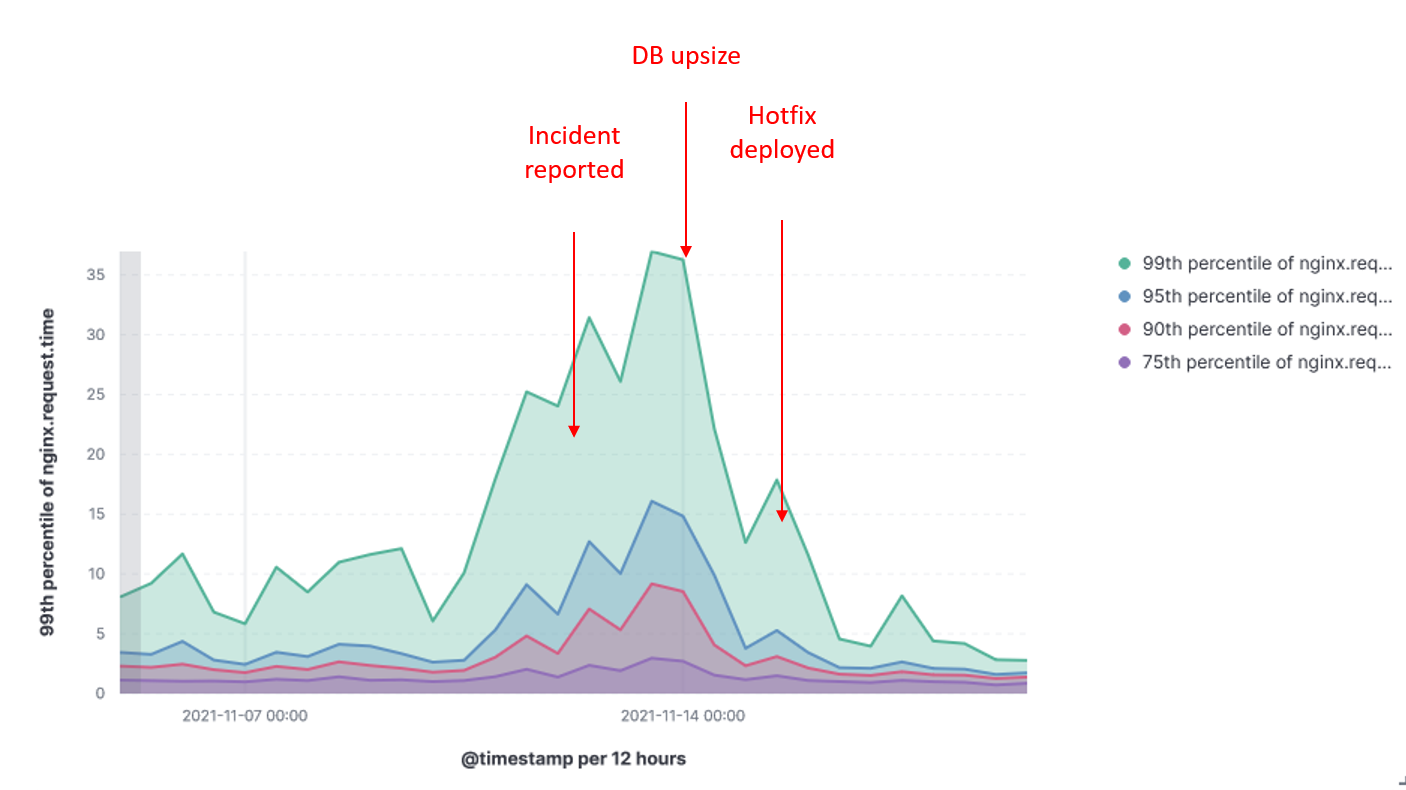
Response time:
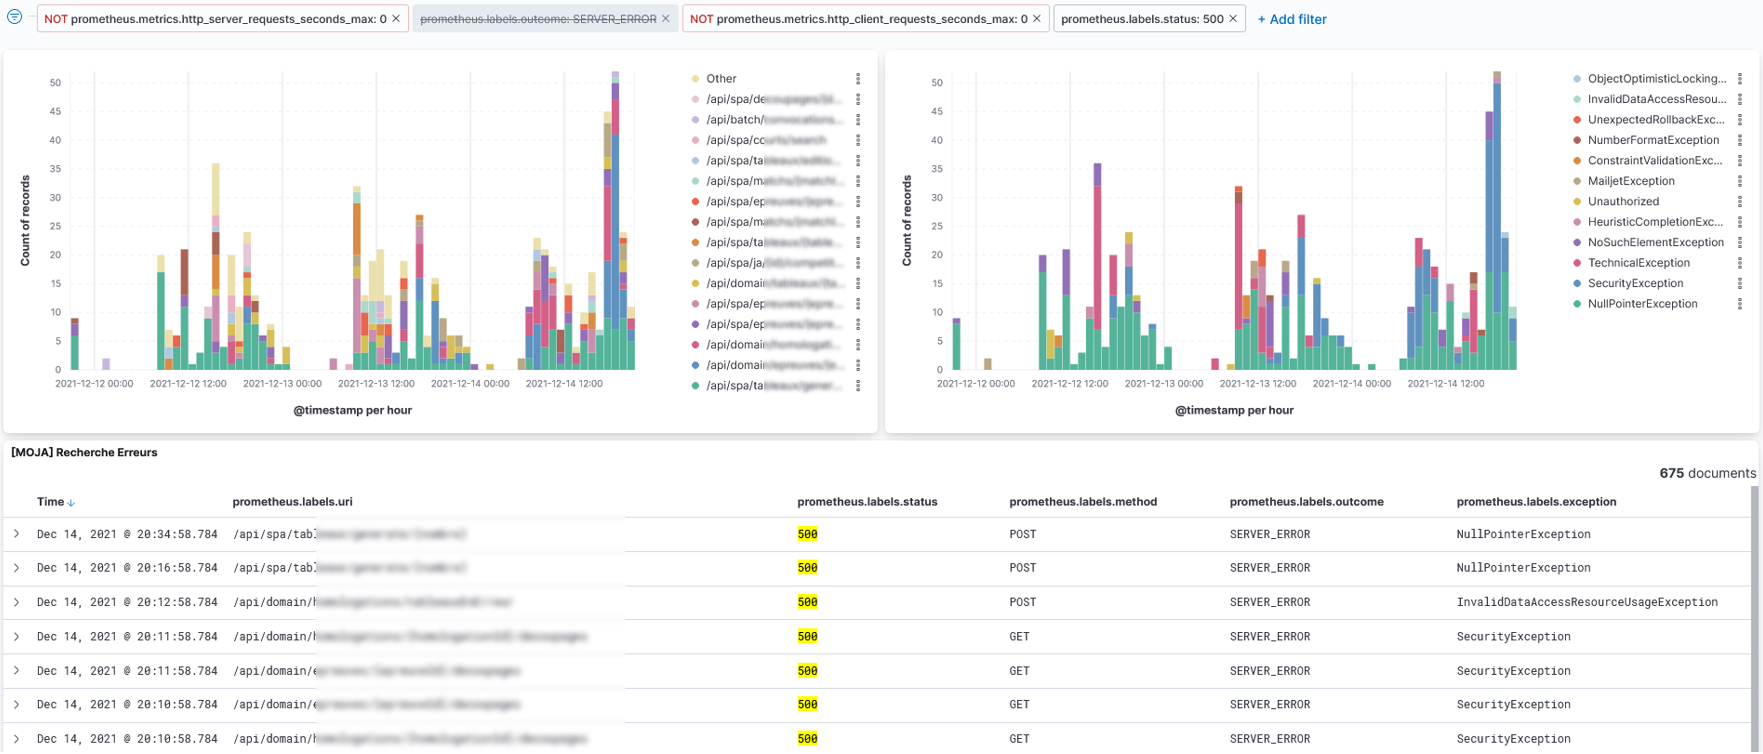
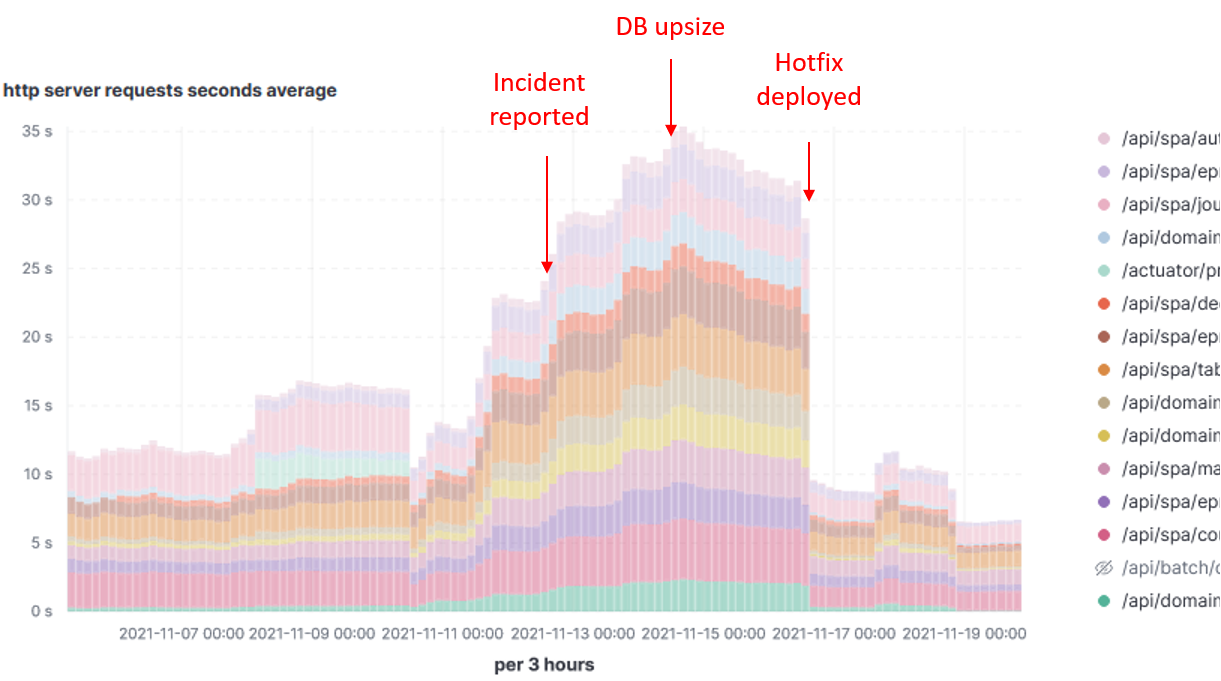
 Response time by HTTP path:
 Execution time of java methods:
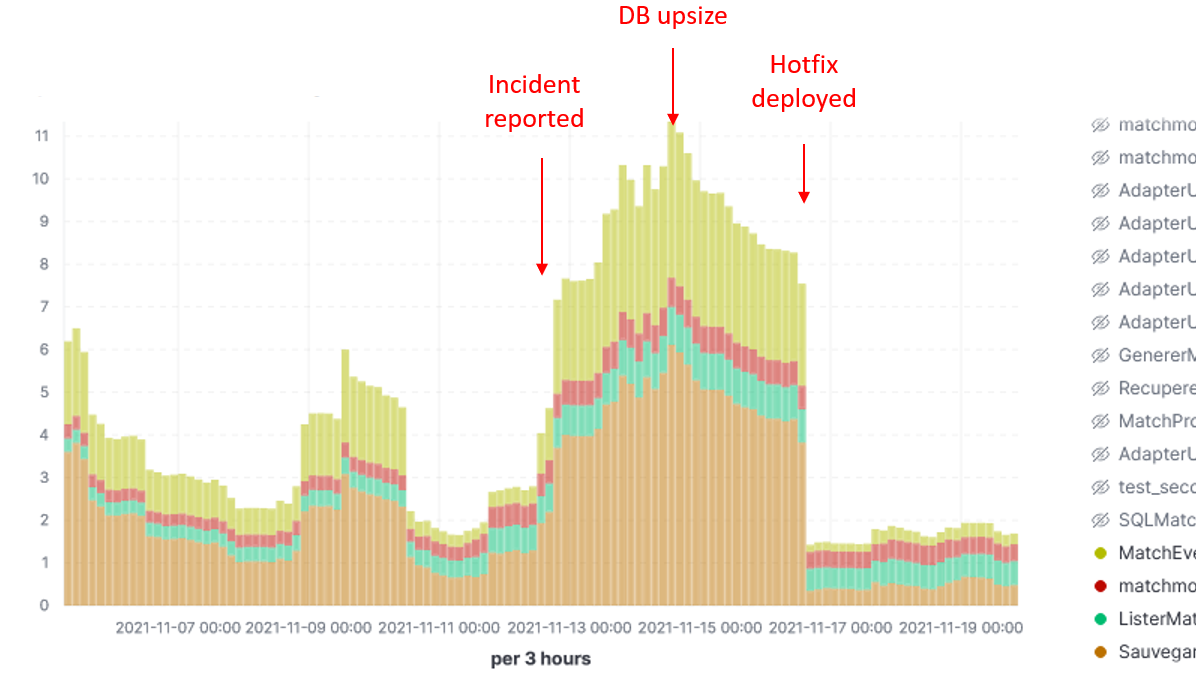
As I plotted the response time for that particular period, and guess what !! They went really up. I have also found out the following information:
- Response time was already increasing for several days due to increasing number of users.
- The business team reported the problem 1 day after incident.
- Developers were stuck for days not knowing were all of this came. They were manually reading logs in Cloudwatch.
- A DB upsize was done 2 days after the incident was revealed and it helped improving situation.
- A hotfix deliverd 4 days after the incident has been effective solving the problem.
As we can see the monitoring solution does effectively help detect and even anticipate problems, as well as measuring the impact of adopted measures.
Now, with the information we have, we finally have happy developers and satisfied users.